Documenting the disappearance of our night skies through panoramic photography and scientific measurements
Explore the Map View PanoramasSkyArchive is dedicated to documenting and raising awareness about light pollution through systematic night sky imaging, scientific measurements, and visual storytelling.
SkyArchive aims to create a comprehensive and interactive global database and archive of night sky observations—documenting the beauty of the night and how light pollution impacts our ability to see stars and celestial objects.
360° panoramas and sky brightness measurements are collected using a custom imaging and photometric system, ensuring consistency and scientific integrity across all locations.
Images are processed using a standardized workflow for visual accuracy and stitched into seamless panoramas. These are presented interactively on the SkyArchive website.
Explore an ever-growing archive through our interactive map, where each location includes a high-resolution panorama and corresponding light pollution data.
Panoramas are linked via interactive "gateway points," allowing users to seamlessly jump between nearby locations—similar to Google Street View, but focused entirely on the night sky.
Click on any colored marker on the map to see details about the location, including the calculated median Sky Quality Meter (SQM) reading (from measurements > 45° altitude) and the date. If multiple panoramas exist for a location, you'll be able to choose which one to view. Use the / buttons or scroll/pinch to zoom.
This map is based on raw data kindly provided by David Lorenz, who recalculated Pierantonio Cinzano's original atlas using newer VIIRS data.
Higher SQM values indicate darker skies. Colors correspond to color of the observation circles, not the color of the light pollution map.
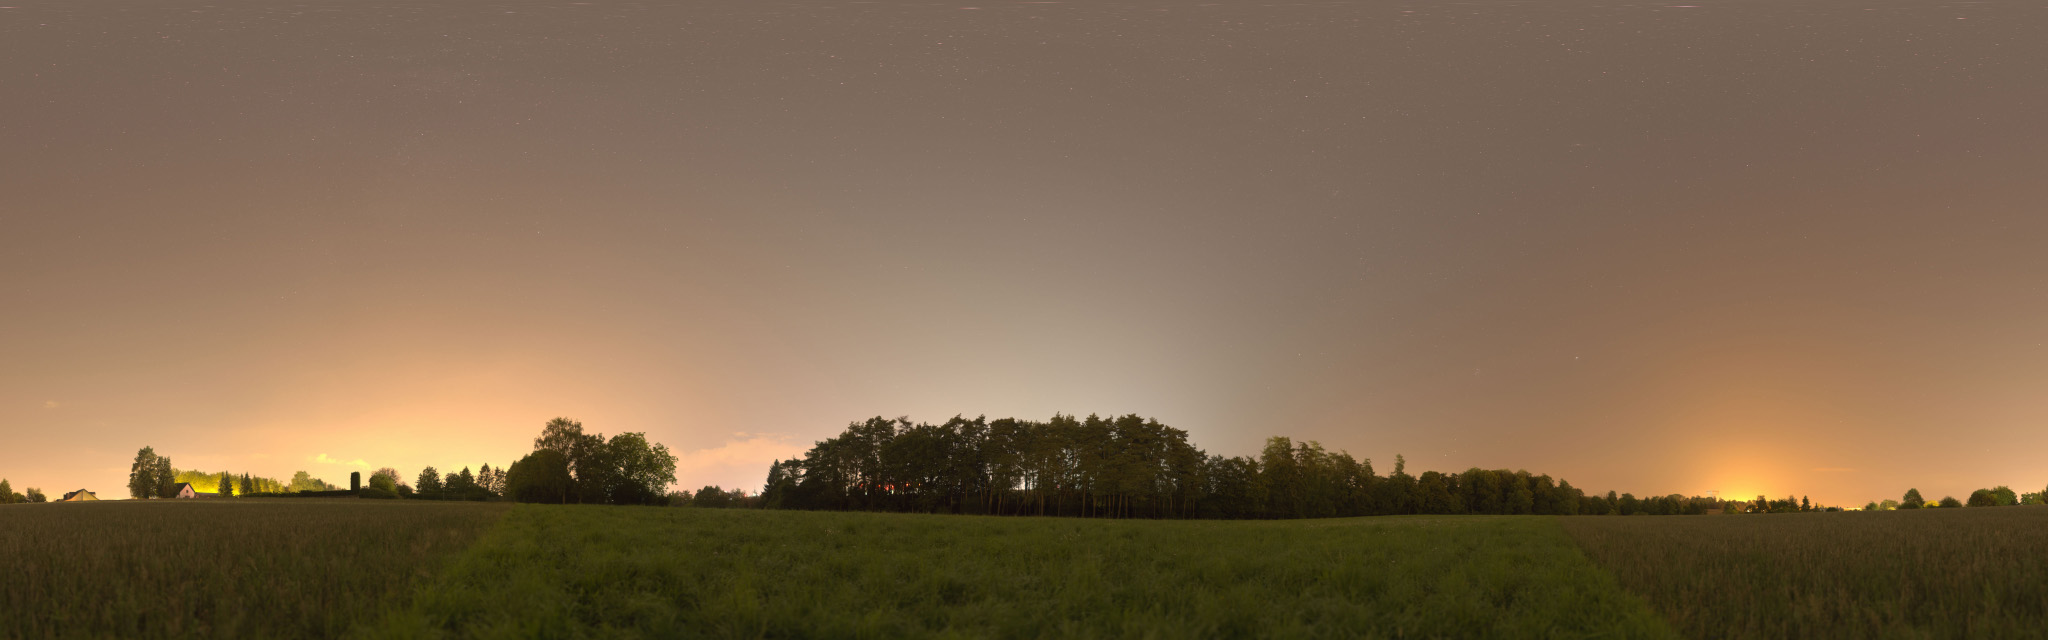
Pragelpass, Switzerland. Many stars and the Milky Way are clearly visible.
Sandweiler, Luxembourg (near airport). Skyglow washes out stars and the Milky Way.
These images illustrate the significant difference in night sky visibility under varying light pollution levels.
Explore interactive 360° views of the night sky from various locations, revealing the impact of light pollution
A glimpse into the wonders of the deep sky captured by SkyArchive.
Quantitative measurements of night sky brightness using Sky Quality Meter (SQM) readings
The Sky Quality Meter measures the brightness of the night sky in magnitudes per square arcsecond (mag/arcsec²). Higher values indicate darker skies:
Analysis of collected data shows potential trends in sky brightness changes over time. Continuous monitoring is crucial.
This corresponds to a significant loss of visible stars compared to pristine conditions.
Select one of the featured panoramas below to see the distribution of its associated Sky Quality Meter (SQM) measurements. This shows the range and frequency of sky brightness values recorded during the observation.
Histogram bins are 0.2 mag/arcsec² wide, covering 16.0 to 22.0. Values outside this range are grouped into '<16' and '>22' bins.
This plot shows the spatial distribution of the SQM measurements across the sky for the selected location. Points are plotted by altitude (distance from center, 90°=zenith) and azimuth (angle, N=0°). Color indicates SQM magnitude (brighter color = darker sky).
The specialized tools used to capture and analyze night sky data
A custom-built motorized gimbal system captures high-resolution 360° night sky panoramas, currently using a Sony α6700 paired with a fast f/0.95 lens. Each panorama consists of dozens of overlapping RAW images taken with identical exposure settings for consistent, location-independent imaging quality.
This system enables precise documentation of sky visibility and artificial light interference across the entire celestial dome.
The TAS (TESS AutoScan) is a motorized Sky Quality Meter that scans the sky at 145 angles, recording quantitative brightness values in mag/arcsec². These measurements are later overlaid on the panoramic images.
The system provides accurate, objective data to complement and enhance the visual documentation.
RAW images are processed in RawTherapee using a custom profile developed specifically for SkyArchive, ensuring consistent and accurate visual results across all locations. Panoramas are stitched using Microsoft ICE.
Interactive views are rendered with Pannellum, while custom Python scripts handle data normalization and integration of sky brightness metrics.
Contribute to the project or learn how to reduce light pollution in your community
Are you documenting light pollution? We welcome contributions. Contact us for standardization guidelines.
Submission GuidelinesLearn how to advocate for responsible lighting policies. We provide resources and guidance.
Advocacy Resources